Device and Browser Analytics
- 08 Jul 2024
- 1 Minute to read
- Contributors

- Print
- DarkLight
- PDF
Device and Browser Analytics
- Updated on 08 Jul 2024
- 1 Minute to read
- Contributors
- Print
- DarkLight
- PDF
Article summary
Did you find this summary helpful?
Thank you for your feedback
Overview
The Invisible App's integration of device and browser analytics empowers citizen developers with comprehensive insights into user engagement patterns. This feature enhances the ability to understand and adapt to user interactions across various platforms.
Key Features
Automatic Data Logging
When a user accesses the Invisible App, the system automatically logs the following details:
Device Type: Identifies the hardware used to access the app. The first device a user uses to access the Invisible App will be logged, even if they switch devices later. For example, if they start on their iPhone and switch to a MacBook, only the iPhone is captured.
Operating System: Determines the operating system running on the user’s device.
Browser Type and Version: Captures the browser used and its version number.
Note: Data logging will commence only after the user successfully passes the bot detection page.
Data Storage and Workflow Customization
The captured data is stored as system variables, facilitating intricate customizations and condition-based actions within the app workflows. Citizen developers can leverage these variables to tailor app behavior based on the analysis of device and browser usage.
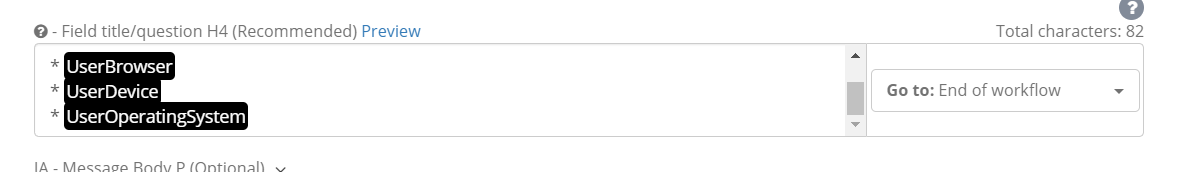
UserBrowser: The browser used by the user.
UserOperatingSystem: The operating system used by the user.
UserDevice: The device used by the user.
Access Channels
Citizen developers can track device and browser details from user interactions via multiple channels, including:
Desktop Invisible App (Desktop IA)
Conversational Invisible App (Convo IA)
Ushur Hub
Invisible App accessed through SMS
Invisible App accessed through email
View Device and Browser Analytics in an Engagement
To access analytics from a specific engagement, follow these steps:
From the main menu, select the Initiated Activities tab to view a summary of all engagements.
Within the Initiated Activities Summary Table, find the engagement you are interested in.
Click the History icon in the Action column corresponding to your selected engagement. This dialog box will appear, showing detailed engagement metrics.
Under the UOB (User on Browser) link accessed title in the dialog box, you will find details such as:
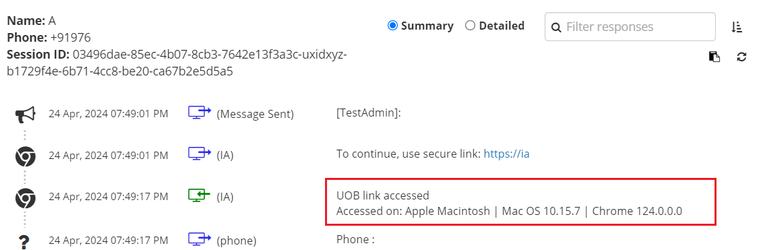
Device Type: Shows the type of device used.
Operating System: Displays the operating system of the device.
Browser Type and Version: Lists the browser and its version used during the interaction.

Was this article helpful?